
After serving for 13 1/2 years as Baruch College's Geospatial Data Librarian, it is time for me to say goodbye. My last day at the College will be Jan 31, 2021. We have accomplished so much great work in the lab and have helped thousands of people meet their research goals through our services and data resources. It has been a pleasure to serve the intrepid students and dedicated faculty and staff at Baruch College and throughout CUNY, as well as the citizens of New York and people from around the world who were able to use our resources to good effect.
The GIS Lab is still closed due to COVID-19, and is vacant not only physically but also virtually with my departure. The Newman Library will be working to fill this position, but it could take some time. In the interim, feel free to contact a member of the library's Data Services Group for assistance with your data needs.
On Feb 1, 2021, I will become the new GIS and Data Librarian at Brown University Libraries. If you're looking for me, you can reach me there.
Best wishes,
Frank Donnelly
A couple of brief updates before we close out 2020:
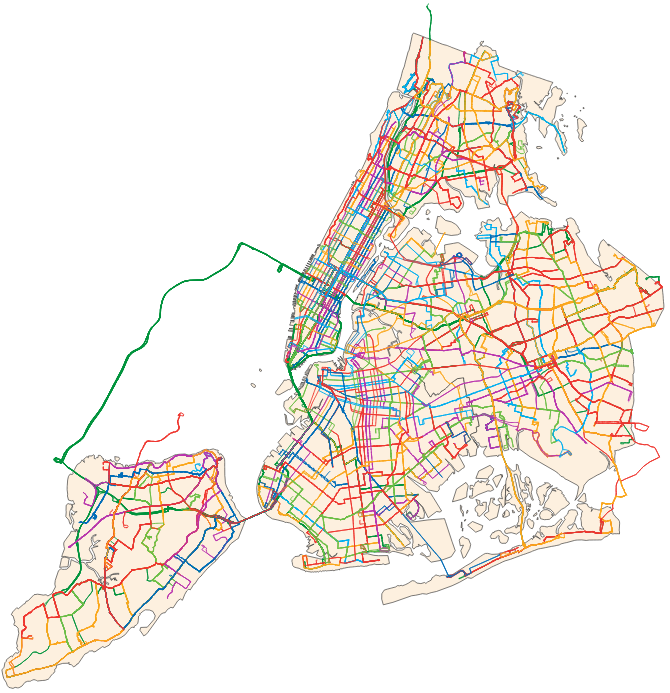
- I've updated the bus and subway layers that are part of our NYC Mass Transit Spatial Layers series. These layers for Nov 2020 capture the resumption of "normal" services relative to our May 2020 layers. The May 2020 series reflected the suspension of many bus and subway routes during the first wave of the COVID-19 pandemic. All of the old layers have been moved to our archives page. No updates to the railroad files this time, as nothing significant has changed.
- I've also added a new iteration to our file of IRS Tax Exempt Organizations in NYC for Dec 2020; the previous file was for June 2020.
- I plan to update the metadata files for some of our smaller series (population centroids, CUNY campus layers) to our new metadata standard over the winter session.
The lab will be virtually "closed" during the last two weeks of December. Remote operations will resume on a limited basis for the 2021 winter session from Jan 4 to 25, before returning to five days a week for spring 2021. We will continue to work remotely throughout the spring semester. I'll be updating the hours on the GIS Lab page before this week is out.
Happy holidays!
The GIS Lab at the Baruch College library is offering two remote workshops via Zoom on Fridays during the Fall 2020 semester: a self-directed Intro to GIS workshop using QGIS and an introductory presentation and demonstration on US census data. Details for the sessions are below.
Advance registration is required, and is limited to current: Baruch College undergraduates (including Macaulay Honors affiliates), CUNY graduate students, and CUNY faculty and staff. Participants must be completely comfortable with using Zoom (tech support cannot be provided by the instructor).
Frank Donnelly is the Geospatial Data Librarian at Baruch and is the instructor for these series. He is the author of Exploring the US Census: Your Guide to America's Data, and has introduced over 400 people to GIS through his day-long workshop series.
Introduction to QGIS: A Self-directed Workshop
PLEASE NOTE: Registration for this workshop is closed, all seats have been filled
Do you have a research question that you'd like to envision geographically? Maybe you'd like to study neighborhoods to target a market or measure the distribution of public services. Or perhaps you want to visualize various resources or socio-economic and demographic characteristics across the country or around the world. Have you ever wanted to add a map to a report or presentation, but couldn't find one that suits your needs?
This introductory workshop showcases the basic and fundamental principles of using geographic information systems (GIS) to process geospatial data, conduct geographical analyses, and create maps using the free and open source QGIS software package. In this remote and self-directed series, participants will attend an introductory GIS presentation and orientation session via Zoom, and then will spend one week working through exercises in a comprehensive GIS workbook. The workbook includes clear step-by-step instructions with screenshots, and separate commentary that explains each task. Halfway through the week, participants can attend an optional drop-in session for assistance with the material, and at the end of the week the series concludes with a second Zoom session to summarize what we have learned, demonstrate free sources of GIS data, and provide participants with the opportunity to ask specific questions that pertain to their own research projects.
Dates
- Friday Oct 16 and Oct 23: 10am-11:30am (optional drop-in sessions Tue Oct 20)
For full details and to register, visit: https://guides.newman.baruch.cuny.edu/gis/intro_qgis_remote
Introduction to US Census Data
How many people live in my neighborhood? How many Americans have a college degree? Which counties have the highest percentage of public transit users? What is the composition of the population or labor force by age and sex for my city or town? These questions and many more can be answered by the census. More than just a ten-year population count, the US Census is a vast ecosystem of datasets that can be used for describing places and groups of people. Understanding how the census is organized and knowing which sources to use are the keys for unlocking these valuable datasets.
This remote Zoom session includes a presentation that provides a conceptual overview of the census, so you can learn to choose the best data and sources for answering your specific research questions, and live demonstrations of several publicly available tools for accessing data. Basic sources for looking up stats and getting a broad profile for an area, as well as more advanced tools like data.census.gov for generating detailed comparison tables, will be demonstrated. Participants will have the opportunity to ask specific questions related to their research.
Dates
- Friday Oct 2: 10am-11:30am
- Friday Nov 20: 10am-11:30am
For full details and to register, visit: https://guides.newman.baruch.cuny.edu/gis/intro_census_remote
As the summer is drawing to a close I've updated several of our datasets:
- NYC Geodatabase: the new version for aug2020 contains new ZIP Code Business Patterns data for 2018, published at the ZCTA level, and new layers for NYC subway complexes and PATH train stations that contain ridership data for 2019.
- NYC Mass Transit Spatial Layers: just a small update, for those who prefer to access the subway ridership data in a non-spatial spreadsheet format, this data is posted alongside the other mass transit features.
- IRS Tax Exempt Organizations: a spreadsheet that lists all of the tax exempt, non-profits in NYC has been added that is current as of June 2020. We've been updating this data fairly consistently every June and December each year. I revised all of the metadata for these files based on our new standards.
Lastly, Ryan wrote a final tutorial before his last day in the lab this past June. It's an introduction to the new ArcGIS Storymaps, where he revised and updated our existing tutorial for the classic ESRI StoryMaps. All of these tutorials are available on our Resources page.
The GIS Lab will continue to be physically closed during Fall 2020, but will continue to offer remote, on-line services. I'll post new hours within the next few weeks.
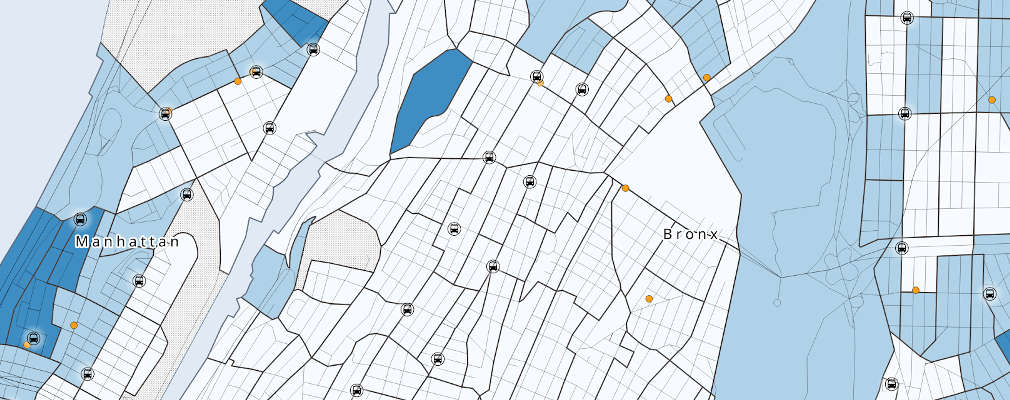
I've just posted the latest version of the NYC Mass Transit Spatial Layers for May 2020. This version includes updates for routes and stops for the buses, express buses, and subway; there's also an updated spreadsheet for PATH Train ridership that includes 2019. Unlike previous updates, I've kept the previous versions of the transit files for December 2019 (buses) and May 2019 (subway) on the main download page instead of moving them to the archives page. These older files represent regular or "normal" service, pre-COVID-19.
Data for our series is generated from the static data developer feeds published by the MTA. The layers released for the May 2020 edition of our series represent reduced, essential service due to the COVID-19 pandemic. Compared to the previous edition that we published in December 2019, 40 bus routes were eliminated, most of them in Staten Island. The following 40 local and express bus routes that appeared in dec2019 were not present in may2020:
BX20, M98, Q26, S42, S66, S81, S84, S86, S90, S91, S92, S93, S94, S96, S98, SIM1, SIM10, SIM11, SIM15, SIM2, SIM22, SIM25, SIM26, SIM3, SIM30, SIM31, SIM32, SIM33, SIM34, SIM35, SIM4, SIM4X, SIM5, SIM6, SIM7, SIM8, SIM8X, SIM9, X37, X38.
One local route was present in may2020 that did not exist in dec2019: M191.
As a result, there was also a decrease in the number of bus stops. Some routes operated by private companies that contract with the MTA (for example SIM23 and SIM24) continue to operate, but these routes are never captured in the source data as the MTA does not own and operate them.
Reduced service for the NYC Subway was not reflected in the data feeds, so the GIS Lab created these layers manually by modifying the subway routes and stops layers that we published in May 2019. The following subway routes were not operating in May 2020 and were removed: B, W, Z, and S shuttle from Times Square to Grand Central Station. In addition, the A and 5 trains eliminated service on certain branches. We also modified the group field, which is used for styling the routes with their trunk color, by removing the closed services.
We added a field named COVID_CHG to the subway stops layer that indicates which trains were removed or added for these stops, prefaced with a minus or plus sign, and modified the trains field accordingly to indicate the trains that stop there. There were 110 stops where service was impacted: 110 stops lost a train service, and 4 gained a service. The two stops for the shuttle to Times Square and Grand Central (S train) are closed and have no train service; we kept the stops in the dataset, added CLOSED to the stop name, and removed the train designation from the trains field.
We did not publish updates for the Metro North or LIRR for this edition, because there had been no changes in the underlying source data.
Even though we're in quarantine, the GIS Lab continues to function remotely. Here are a few updates to our datasets and resources that we've posted lately:
- NYC Geocoded Real Estate Sales for 2019; a new shapefile and a revised database that covers 2003 - 2019.
- A revised QGIS Raster Tutorial, updated for QGIS 3.10 A Coruna.
- A two-page summary that describes what the NYC Geodatabase is and how it works.
- Links from dataset pages to GitHub repos for many of the datasets that the GIS Lab creates. The repos contain scripts that are used for generating these datasets.
I've also implemented a new Geospatial Metadata metadata standard and have begun to roll out records in this format. They're more concise than the ISO records we've used in the past and do a better job in providing a quick overview of each dataset and layer.
You can continue to contact me with questions via email. The physical lab will likely remained closed over the summer, but I'll post contact hours in a few weeks.
I just posted a revised version of the GIS Practicum manual, updated for the latest Long Term Release for QGIS, 3.10 A Coruna. There aren't any earth shattering changes between this version and the previous LTR (3.4 Madeira) as far as the basics go, but I've captured the small changes that might throw off novices. Examples of this include generic layer names like 'Clipped' and 'Buffer' that were applied to any output files of geoprocessing operations (practice discontinued in 3.10) and the replacement of the term 'quantiles' (used in every previous version of QGIS) with 'equal counts' (new in 3.10). I also took the opportunity to condense some of the material, in particular the coordinate transformation exercises in chapter 4 which I've reduced from two sections to one. I found that this was overkill for the in-person workshops. I also swapped out some data files with more recent ones, and of course updated any broken links I could find.
For the moment I'm keeping the old version of the manual for 3.4 up, alongside the new version for 3.10. Since we're in the middle of the semester I thought other people may still be using it. The 3.4 manual will come down towards the end of May 2020.
I just updated the IRS Migration Database, which can be used to study point to point inflows and outflows of domestic migrants from state to state and county to county, based on address changes between two consecutive years of 1040 tax filings. There are two new years of data in this update that cover moves between 2016 to 2017 and 2017 to 2018. Our databases now contain 30 years of data for states and 28 for counties. All of this data was extracted from the IRS SOI US Population Migration Data series.
In other news, every campus throughout CUNY has been shut down for the rest of the semester due to COVID-19, which means the GIS Lab is also closed. We are working remotely: I am responding to email questions, Baruch and CUNY affiliates can make requests for virtual appointments via Zoom, and our tutorials and datasets continue to be updated.
It's been a while, but we've finally released the latest version of the NYC Geodatabase! The database contains a number of updates:
- New data tables for PUMAs, ZCTAs, and census tracts from the 2014-2018 ACS (replacing the 2013-2017 iteration).
- New data tables for ZCTAs from the 2017 ZIP Code Business Patterns (replacing 2016 iteration). Because of new Census Bureau privacy rules, the number of establishments is suppressed for any place and any industrial sector that has less than 3 business establishments; we've added a new column to our industry table that counts the number of suppressed businesses (by comparing the sum of industries to the published total and taking the difference).
- New subway station, complex, and ridership data for 2018 from the MTA. There is one less subway complex in 2018, do to the construction of a passageway that connects the Cortlandt St RW (formerly complex mn092) to Chambers St / WTC / Park Place ACE23 (complex mn088). Complex mn092 was dropped from the dataset as Cortland St RW is now part of mn088, and all the ridership data for this station was retroactively added to the new, larger complex. The notes table on subway closures has also been updated.
- New PATH station ridership for 2018. For the first time, the NYC geodatabase database includes all the PATH stations in the system, not just the ones in NYC.
- Updated facilities layers for 2019 for colleges, libraries, hospitals, and schools. Unfortunately enrollment data for the schools is no longer published in the facilities database.
As always, we're providing two formats: a SQLite / Spatialite version that's intended for QGIS users, and an MS Access personal geodatabase intended for ArcGIS users. We've updated the data dictionary document, but haven't gotten around to producing new spatial metadata files yet. We'll get those posted in the next month or so.
I have a few data updates to announce before this semester comes to an end. We've updated the bus stop and route layers for the NYC Mass Transit Spatial Layers for December 2019. We decided not to issue updates to the rail and subway files as there were no changes to the underlying data from the static transit feeds. We've also generated an updated list of non-profits in NYC as part of the IRS Tax Exempt Organizations series. The plan for next month is to release an update for the NYC Geodatabase.
The GIS Lab will be closed Dec 23rd through Jan 6th. We'll re-open on Jan 7th for the winter session; see the GIS Lab page for details.
The GIS Lab is officially back in business for the fall 2019 semester! We'll be available Mon-Tue & Thu-Fri 9am-4:30pm, and Wed 1pm-5:30pm. Ryan is also back for the semester and he'll be in on Thu & Fri. Visits are by appointment. See the GIS Lab page for contact info, hours, and exceptions when we'll be closed. The fall semester runs from Aug 27 to Dec 20.
Before the summer was over I managed to post 2018 ridership stats for the NYC subway. Visit the NYC Mass Transit Spatial Layers to access the spreadsheet.
The new data.census.gov has been formally released, and it will replace the American Factfinder as the new census data portal. I've written a new tutorial for it and have updated a few others that mentioned the AFF. Check them out on Census Tutorials page. I'll also be revising my library research guides over the coming weeks.
I decided to delay the release of a new NYC Geodatabase until December or January, because the Census Bureau has delayed the release of the County and ZIP Code Business Patterns data as they're busy tabulating the 2017 Economic Census. This will give us some time to modernize the scripts we use for updating the database. So, the next iteration of the DB at the end of this year will be chock full of new data from the ACS and Business Patterns, and there will be new features for subway stations and NYC facilities like schools, hospitals, and libraries.
Before she left, Chris created two new tutorials to introduce new users to web mapping. Introduction to Carto is for students who register for the Github Student Developer Pack. Learn how to create interactive thematic and reference maps that you can embed and share with others. If you want to create full-fledged presentations that incorporate text, maps, and other multimedia, then check out our ESRI Story Maps tutorial. Create an ArcGIS Online account to get started with telling your stories. These and other tutorials are available via our Resources page.
In other news, I've posted an updated spreadsheet that lists all the non-profits in New York City as of June 2019. See the IRS Tax Exempt Organizations. A reminder that the GIS Lab will be closed for the next two weeks. We'll be back in business on July 15th.
We've just updated our NYC Mass Transit Spatial Layers series, using the MTA's static data feed. This is the most comprehensive update that's we've done in a while, updating stops and routes for the buses, trains, and subway stops. There are a few noteworthy changes. First, the Metro-North routes now actually reflect the routes the trains travel, in that the lines follow the location of tracks. In previous versions the routes were simply straight lines drawn between stations, which made the layer useful for creating metropolitan-level schematics but not much else. With this update, the Metro-North routes layer is now just as good as the subway and LIRR layers for depicting the geographic location of routes:
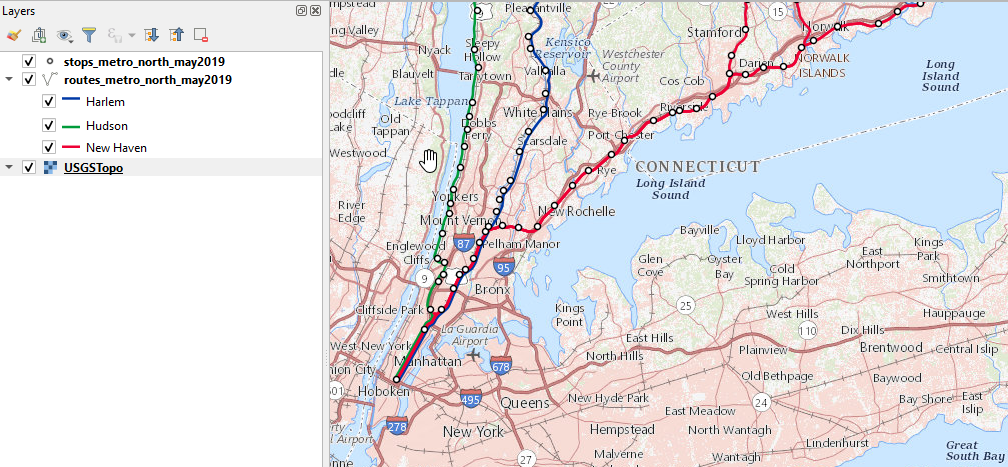
The second big change is that we've created QGIS style files for the Metro-North, LIRR, and subway routes. If you add the shapefile to QGIS it will read the accompanying qml file by default and assign appropriate colors and thickness to each line, representing how the routes appear on transit maps. The LIRR styles incorporate overlay ordering, so the lines are drawn on top of one another in a way that approximates the transit map. The subway and Metro-North styles incorporate offsets so you can see lines that run side by side, without one line covering up all the others. You can see an offset example in the image above for Metro-North. If you'd prefer not to apply the styles, you can either turn them off in the symbology tab or move / delete the qml file that accompanies the shapefile.
Last, while we've recently been including the color hex code in the attribute table of each of the routes file, we've modified these attributes to insert the pound symbol in front of the six-digit code so you can readily apply these colors in QGIS. For example, for the bus routes if you go into the Symbology Tab under the Properties menu and select Single line, beside the color drop down you can click the data defined button, and for field type string you can specify the color field:
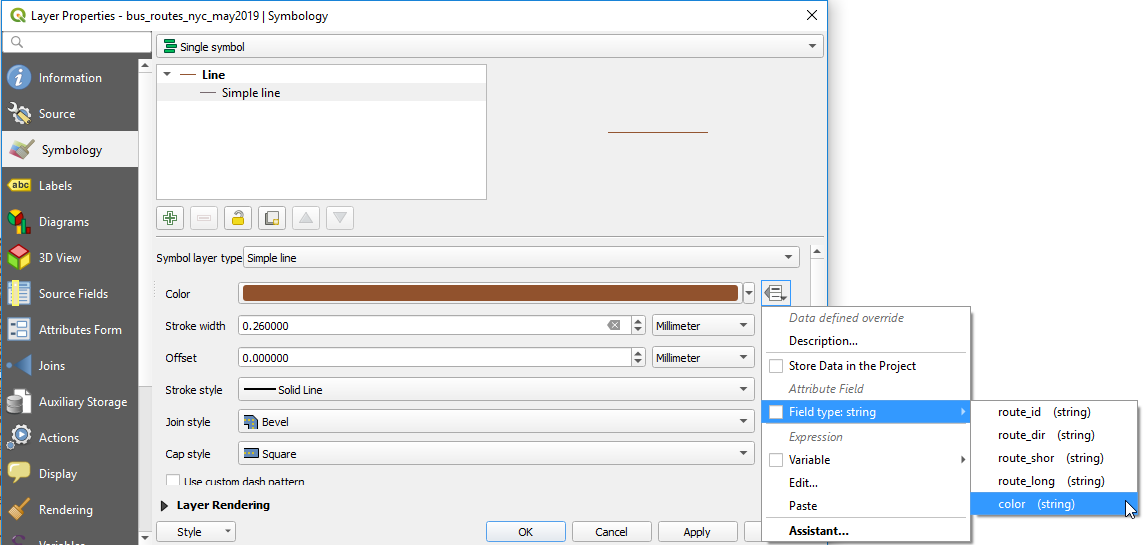
After making the selection and applying it, each line is symbolized using the color stored in this attribute column:
This is a quick way for assigning colors. It won't display the colors by line in the legend; to do that you would need to create a style file. ArcGIS users can also use the colors stored in the table to create layer files, which are the equivalent of QGIS qml styles.
As always, we've moved the older transit layers to our NYC Mass Transit Spatial Layers Archive. No updates yet for subway ridership I'm afraid. We'll keep an eye on it and will post an update shortly after the data becomes available.
It's been a busy semester, and I have a few updates to share. First and foremost, Ryan has finished a new QGIS Raster Tutorial. Our previous tutorial received a lot of downloads but was now too far out of date, so he wrote a completely new one for QGIS 3.4 that covers the fundamentals of working with rasters. It uses surface temperature and land use and land cover data in NYC as examples. The tutorial and sample data are licensed under Creative Commons for anyone to use and share, so check it out!
Other updates:
- I've updated the GIS Practicum manual for QGIS, moving us from 2.18 Las Palmas to 3.4 Madeira.
- Chris has created updated versions of the CUNY Campus Facilities layers for CUNY campus buildings and properties; our first update for this series in several years.
- We've updated the NYC Geocoded Real Estate Sales database, with new data for 2018 sales.
- I've posted new PATH train ridership data on the NYC Mass Transit Spatial Layers page.
Next items on the list: an update of our NYC mass transit features for May and a probably a new version of the NYC Geodatabase in July. Between now and then we should also hopefully have updates for NYC subway ridership for 2018 (the MTA hasn't posted new data yet). I'm working with Andrew at NYU to get many of our updates posted in their spatial repository, as it's been a couple years since we've actively collaborated on this.
I've also posted hours for the GIS Lab this summer. We'll be open for the last week of May and practically all of June, but will shut down June 28 through July 12. We'll open again Mon-Thu for the remainder of July. August is still a toss-up at this point, so stay tuned.
We've managed to squeeze in a few data updates before the end of the year. It's been a year since our last update to the NYC Geodatabase but we finally have a new edition for January 2019. This one contains a lot of updates: new census data tables for the 2013-2017 ACS and 2016 ZBP, ridership data from 2017 for the NYC subway and PATH trains, a new subway stations layer, and all new layers for facilities (colleges, hospitals, libraries, and schools) from 2018. The data dictionary has been updated so you can read about the changes in more detail; in particular there have been some issues with the facilities layers that have forced us to modify those files from previous versions.
Some smaller updates: we have a new data file listing IRS Tax Exempt Organizations in NYC (non-profits) as of December 2018, and have updated all the map links in the NYC data guide to point to the latest version of the census ACS.
The GIS Lab will be closed for a bit until the holidays have passed. Our hours for the winter session have been posted, and midway through January we'll post hours for spring 2019. Happy New Year!