
We've just updated our NYC Mass Transit Spatial Layers series, using the MTA's static data feed. This is the most comprehensive update that's we've done in a while, updating stops and routes for the buses, trains, and subway stops. There are a few noteworthy changes. First, the Metro-North routes now actually reflect the routes the trains travel, in that the lines follow the location of tracks. In previous versions the routes were simply straight lines drawn between stations, which made the layer useful for creating metropolitan-level schematics but not much else. With this update, the Metro-North routes layer is now just as good as the subway and LIRR layers for depicting the geographic location of routes:
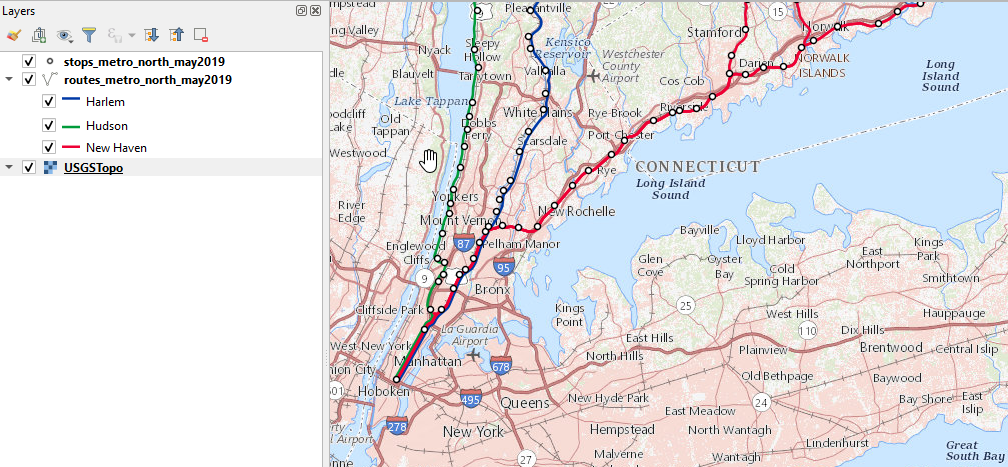
The second big change is that we've created QGIS style files for the Metro-North, LIRR, and subway routes. If you add the shapefile to QGIS it will read the accompanying qml file by default and assign appropriate colors and thickness to each line, representing how the routes appear on transit maps. The LIRR styles incorporate overlay ordering, so the lines are drawn on top of one another in a way that approximates the transit map. The subway and Metro-North styles incorporate offsets so you can see lines that run side by side, without one line covering up all the others. You can see an offset example in the image above for Metro-North. If you'd prefer not to apply the styles, you can either turn them off in the symbology tab or move / delete the qml file that accompanies the shapefile.
Last, while we've recently been including the color hex code in the attribute table of each of the routes file, we've modified these attributes to insert the pound symbol in front of the six-digit code so you can readily apply these colors in QGIS. For example, for the bus routes if you go into the Symbology Tab under the Properties menu and select Single line, beside the color drop down you can click the data defined button, and for field type string you can specify the color field:
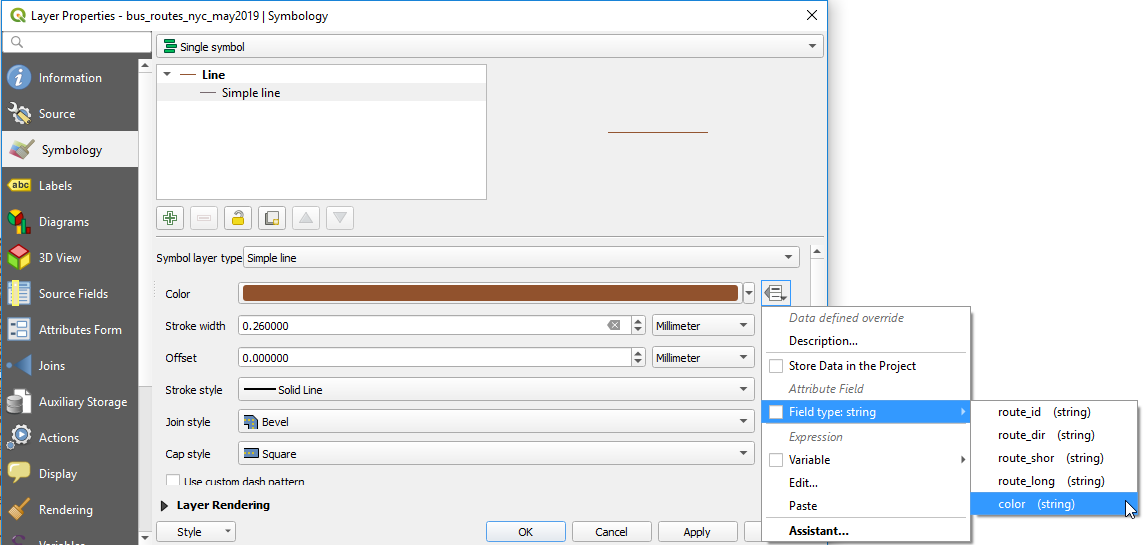
After making the selection and applying it, each line is symbolized using the color stored in this attribute column:
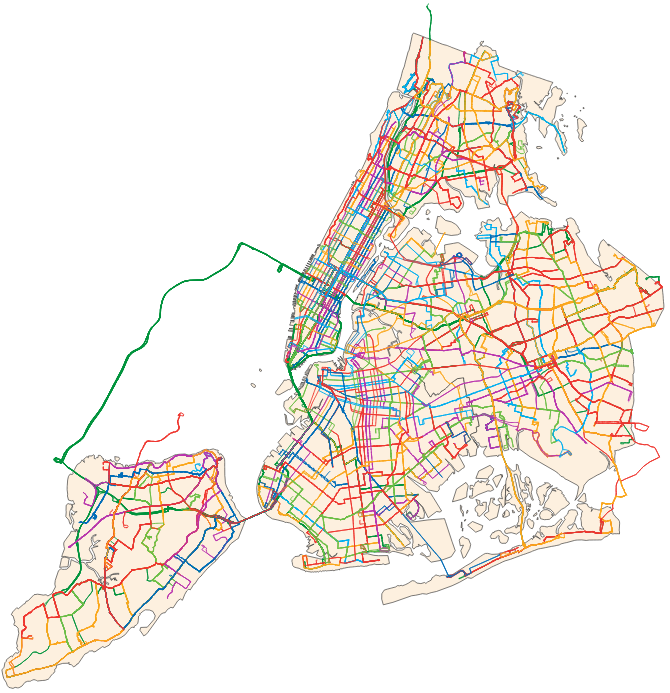
This is a quick way for assigning colors. It won't display the colors by line in the legend; to do that you would need to create a style file. ArcGIS users can also use the colors stored in the table to create layer files, which are the equivalent of QGIS qml styles.
As always, we've moved the older transit layers to our NYC Mass Transit Spatial Layers Archive. No updates yet for subway ridership I'm afraid. We'll keep an eye on it and will post an update shortly after the data becomes available.
It's been a busy semester, and I have a few updates to share. First and foremost, Ryan has finished a new QGIS Raster Tutorial. Our previous tutorial received a lot of downloads but was now too far out of date, so he wrote a completely new one for QGIS 3.4 that covers the fundamentals of working with rasters. It uses surface temperature and land use and land cover data in NYC as examples. The tutorial and sample data are licensed under Creative Commons for anyone to use and share, so check it out!
Other updates:
- I've updated the GIS Practicum manual for QGIS, moving us from 2.18 Las Palmas to 3.4 Madeira.
- Chris has created updated versions of the CUNY Campus Facilities layers for CUNY campus buildings and properties; our first update for this series in several years.
- We've updated the NYC Geocoded Real Estate Sales database, with new data for 2018 sales.
- I've posted new PATH train ridership data on the NYC Mass Transit Spatial Layers page.
Next items on the list: an update of our NYC mass transit features for May and a probably a new version of the NYC Geodatabase in July. Between now and then we should also hopefully have updates for NYC subway ridership for 2018 (the MTA hasn't posted new data yet). I'm working with Andrew at NYU to get many of our updates posted in their spatial repository, as it's been a couple years since we've actively collaborated on this.
I've also posted hours for the GIS Lab this summer. We'll be open for the last week of May and practically all of June, but will shut down June 28 through July 12. We'll open again Mon-Thu for the remainder of July. August is still a toss-up at this point, so stay tuned.